Displaying multiple trees
Auspice has the ability to display two trees side-by-side, and to draw lines between tips with the same name (aka tanglegrams). This is useful to compare the shape of different trees, especially when they are from the same organism – for instance comparing phylogenies constructed from different segments of the same influenza virus can tell you a lot about the different histories of the segments which have the capacity to reassort (see image below).
How to load multiple trees
You can compare any two datasets which you have available – for instance if you had “flu/seasonal/h3n2/ha/2y” and “flu/seasonal/h3n2/na/2y” then loading the URL “flu/seasonal/h3n2/ha/2y:flu/seasonal/h3n2/na/2y” would load them both. A toggle is made available in the sidebar to turn off the lines drawn between tips.
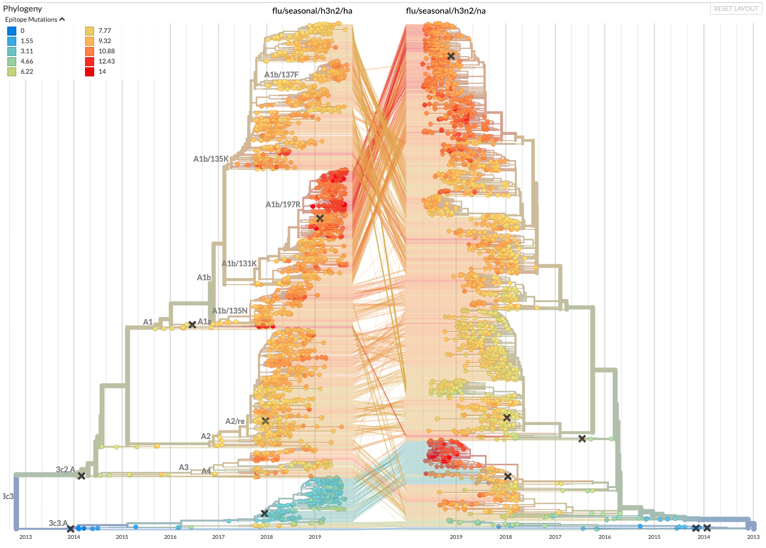 Comparing epitope mutations between HA and NA (worldwide influena H3N2). Notice how the segments can differ drastically in how many epitope mutations they acquire! While the crossing of the lines between the tips doesn’t always prove reassortment, it’s usually a good indication that reassortment is present.