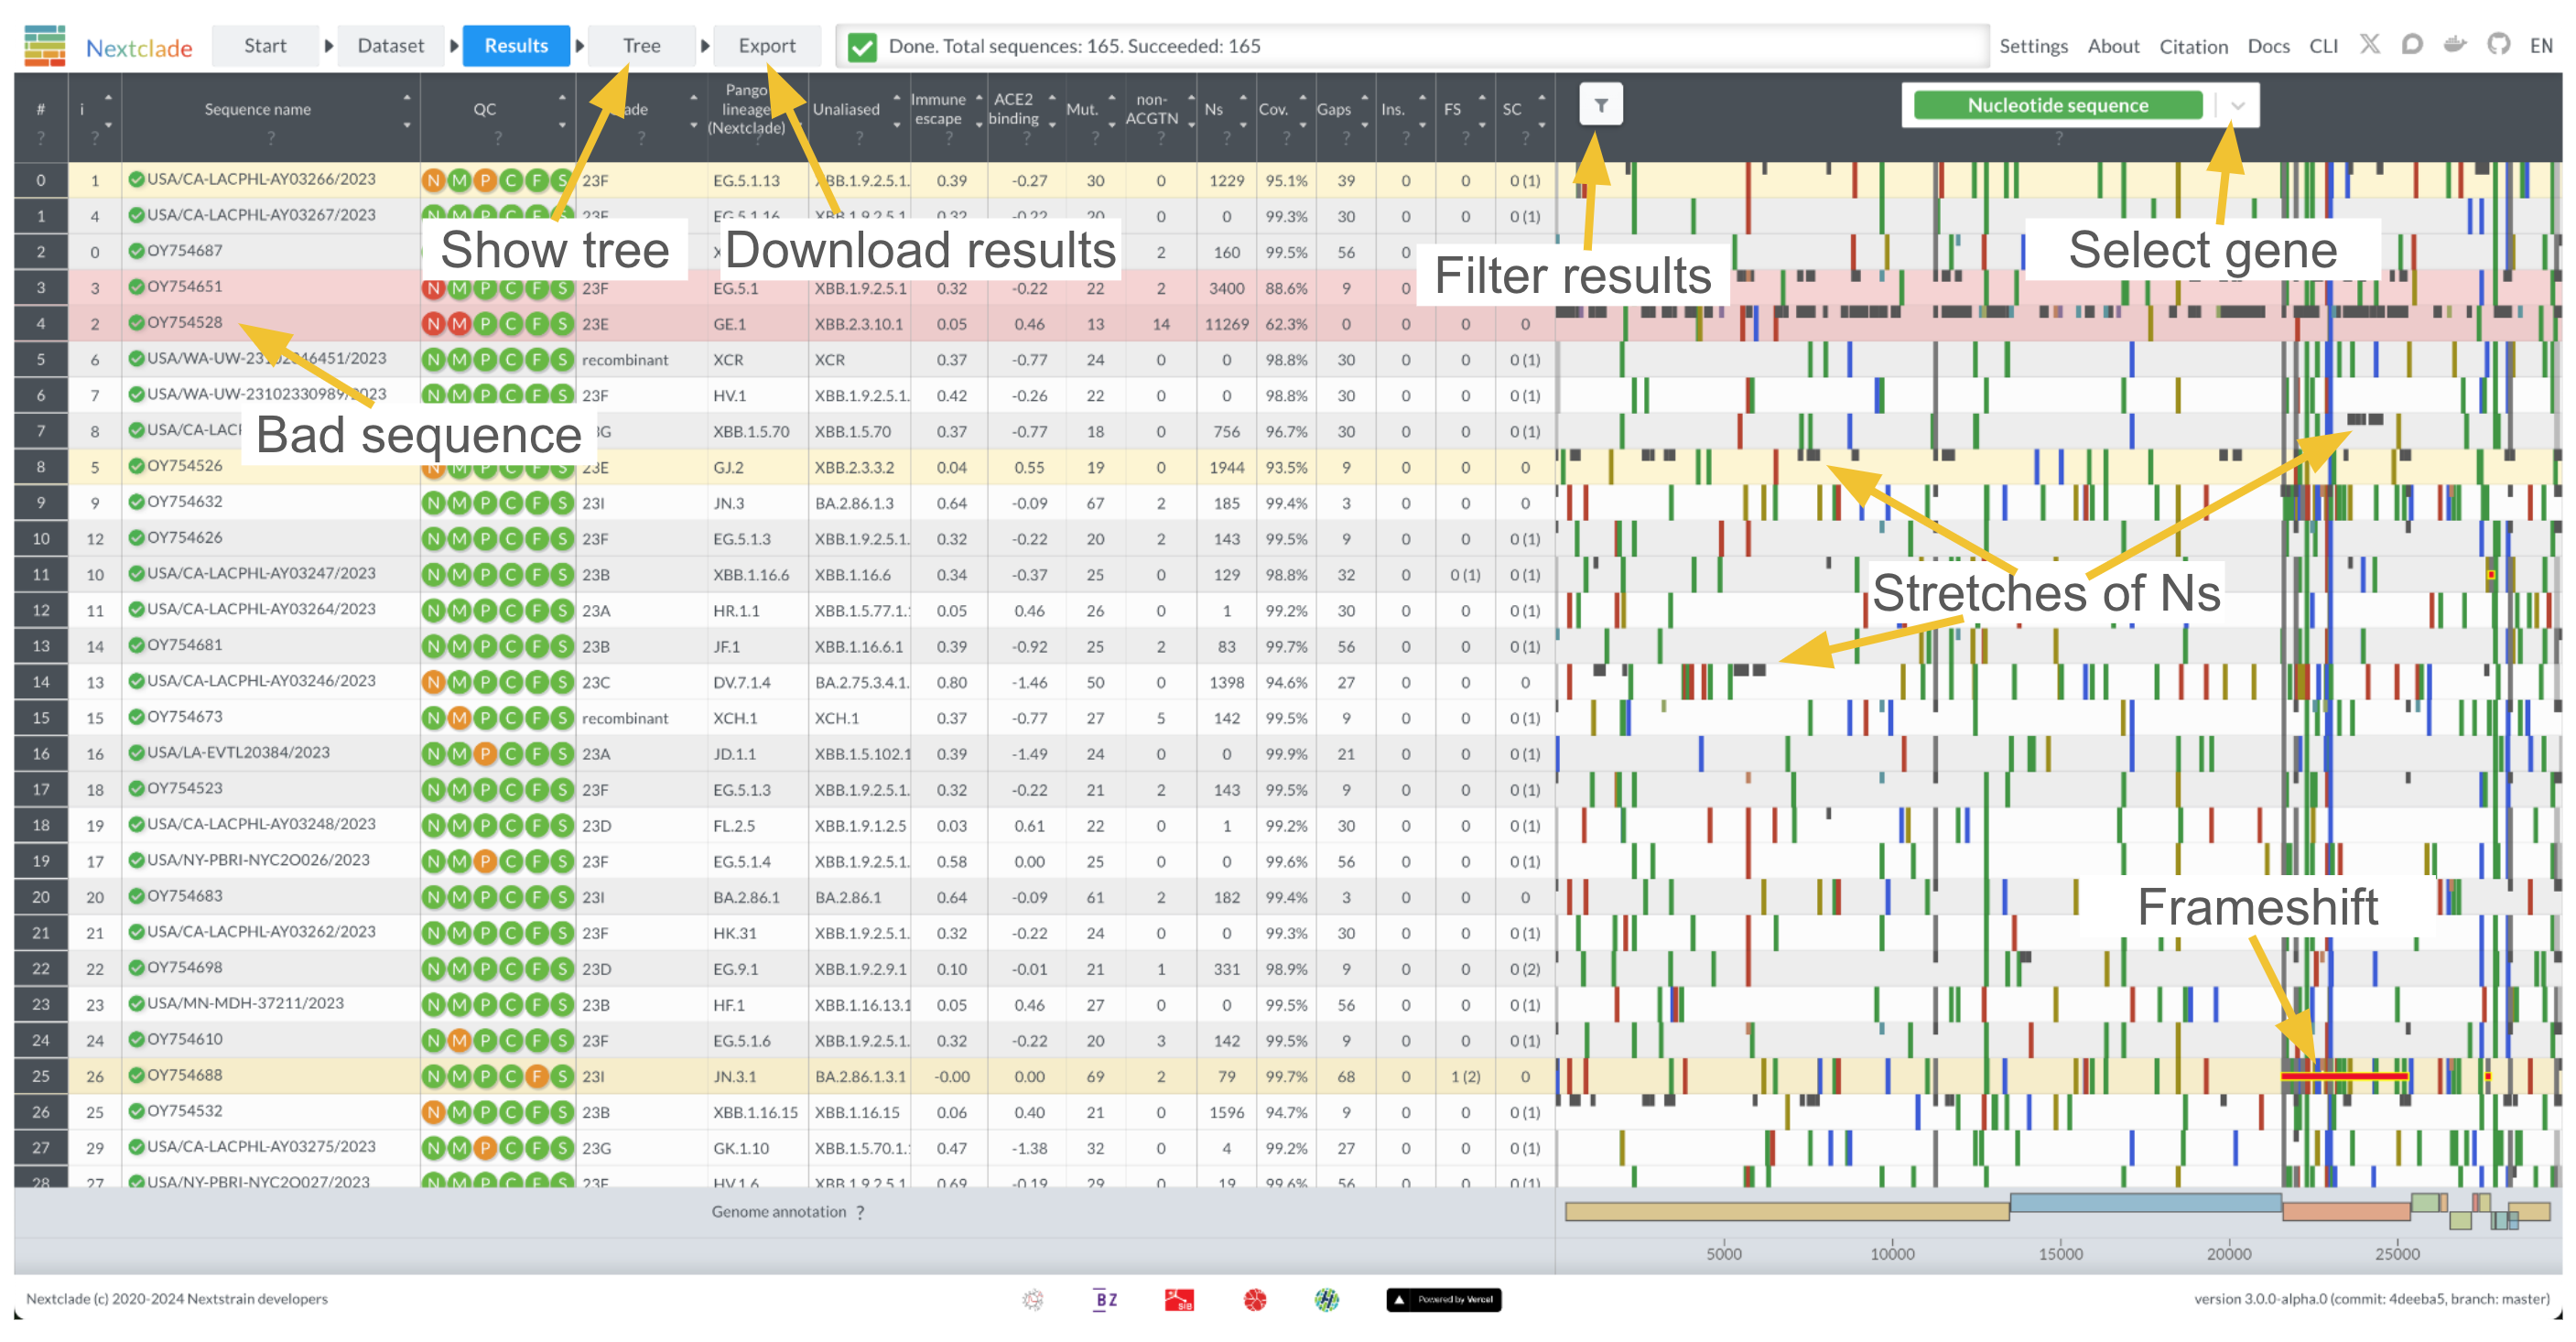
Analysis results table
Nextclade analyzes your sequences locally in your browser. Sequences never leave your computer, ensuring full privacy by design.
⚠️ Since your computer is doing all the computational work (rather than a remote server), it is advisable to analyze at most a few hundred of sequences at a time, depending on your computer hardware. Nextclade leverages all processor cores available on your computer and might require large amounts of system memory to operate. For large-scale analysis (thousands to millions of sequences) you might want to try Nextclade CLI instead.
The analysis pipeline comprises the following steps:
Sequence alignment: Sequences are aligned to the reference genome using a banded Waterman-Smith sequence alignment algorithm.
Translation: Coding nucleotide segments are extracted and translated to amino acid sequences.
Mutation calling: Nucleotide and amino acid changes relative to the reference are identified
Phylogenetic placement: Sequences are placed on a reference tree, private mutations are identified
Clade assignment: Clades are inferred from the place the sequence attached on the reference tree
Quality Control (QC): Quality control metrics are calculated
See the Algorithm section of these docs for more details.
You can get a quick overview of the results screen in the screenshot below:
QC metrics
Nextclade implements a variety of quality control metrics to quickly spot problems in your sequencing/assembly pipeline. You can get a quick idea which of your sequences are having problems by sorting the results table from bad to good (click on the upper arrow in the column “QC”). Bad sequences are colored red, mediocre ones yellow and good ones white. You can view detailed results of the QC metrics by hovering your mouse over a sequences QC entry:
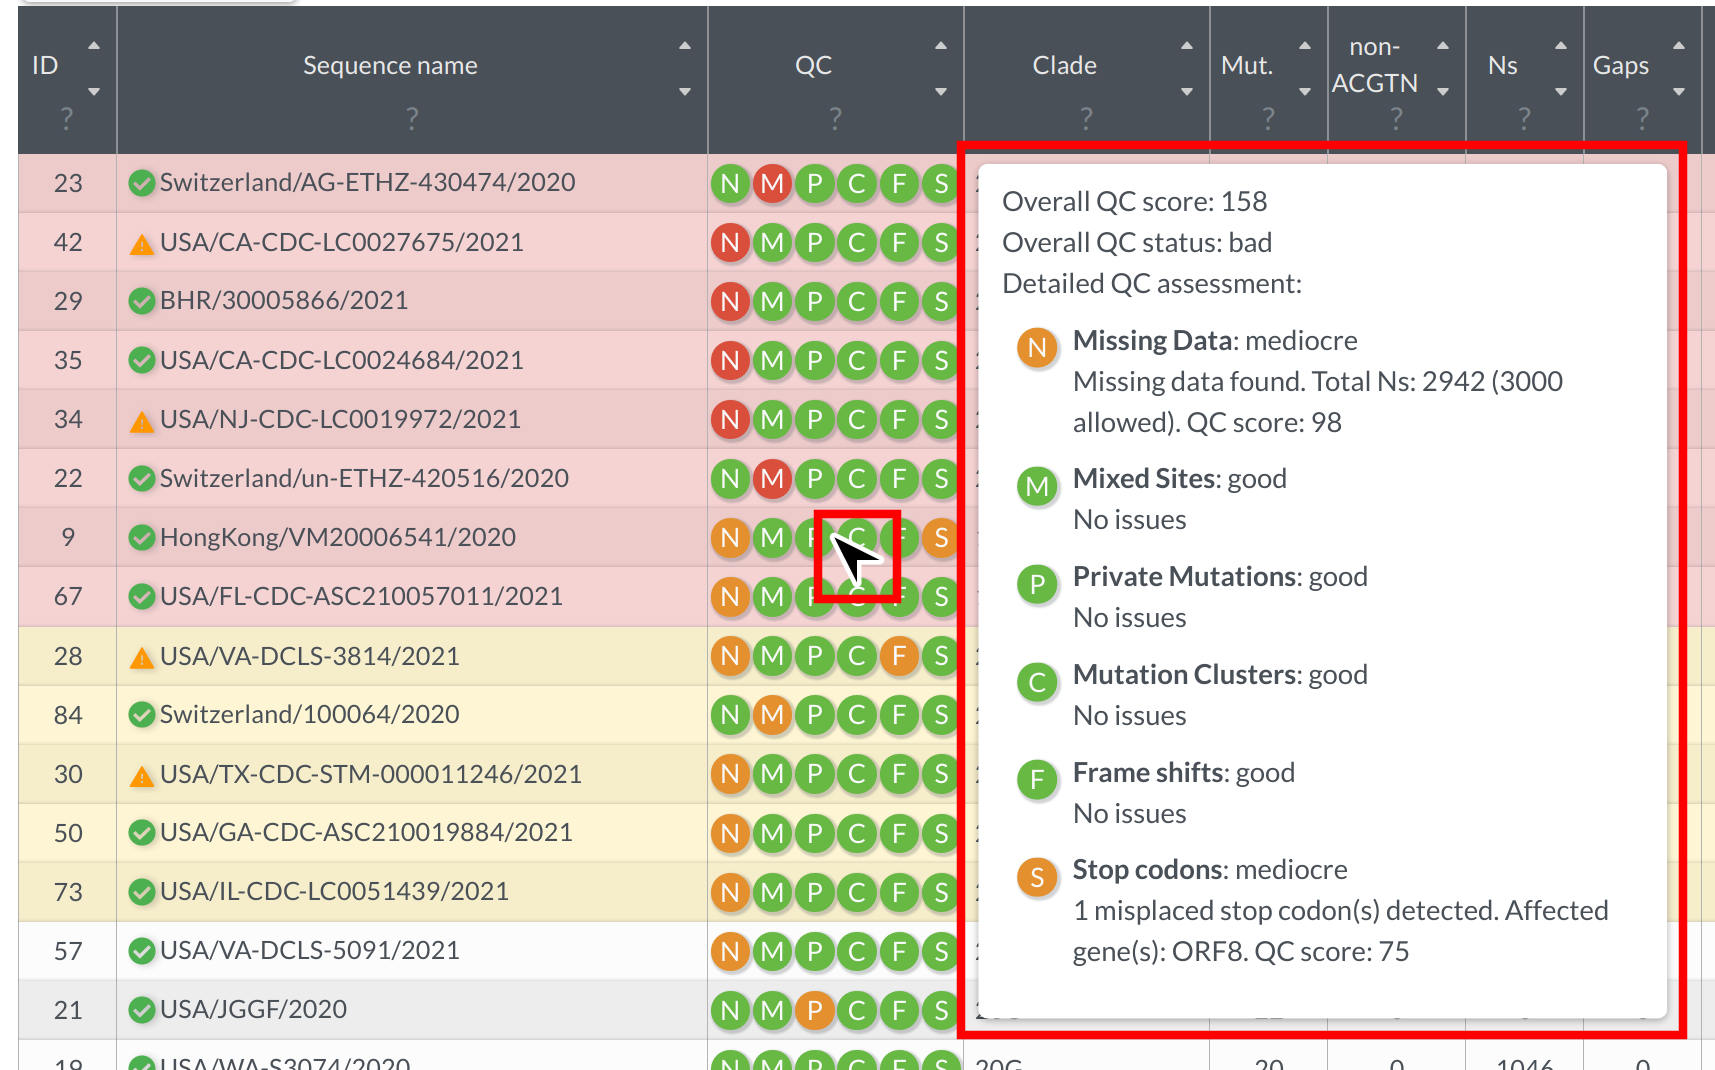
Every icon corresponds to a different metric. See Quality control section for the detailed explanation of QC metrics.
Bear in mind that QC metrics are heuristics and that good quality sequences can occasionally fail some of the metrics (e.g. due to recombination or absence of close relatives in the reference tree).
Table data
Nextclade automatically infers the (probable) clade a sequence belongs to and displays the result in the table. Clades are determined by identifying the clade of the nearest neighbor on a reference tree.
The result table further displays for each sequence:
“Mut.”: number of mutations with respect to the reference sequence
“non-ACGTN”: number of ambiguous nucleotides that are not N
“Ns”: number of missing nucleotides indicated by N
“Gaps”: number of nucleotides that are deleted with respect to the reference sequence
“Ins.”: number of nucleotides that are inserted with respect to the reference sequence
“FS”: Number of uncommon frame shifts (total number, including common frame shifts are in parentheses)
“SC”: Number of uncommon premature stop codons (total number, including common premature stops are in parentheses)
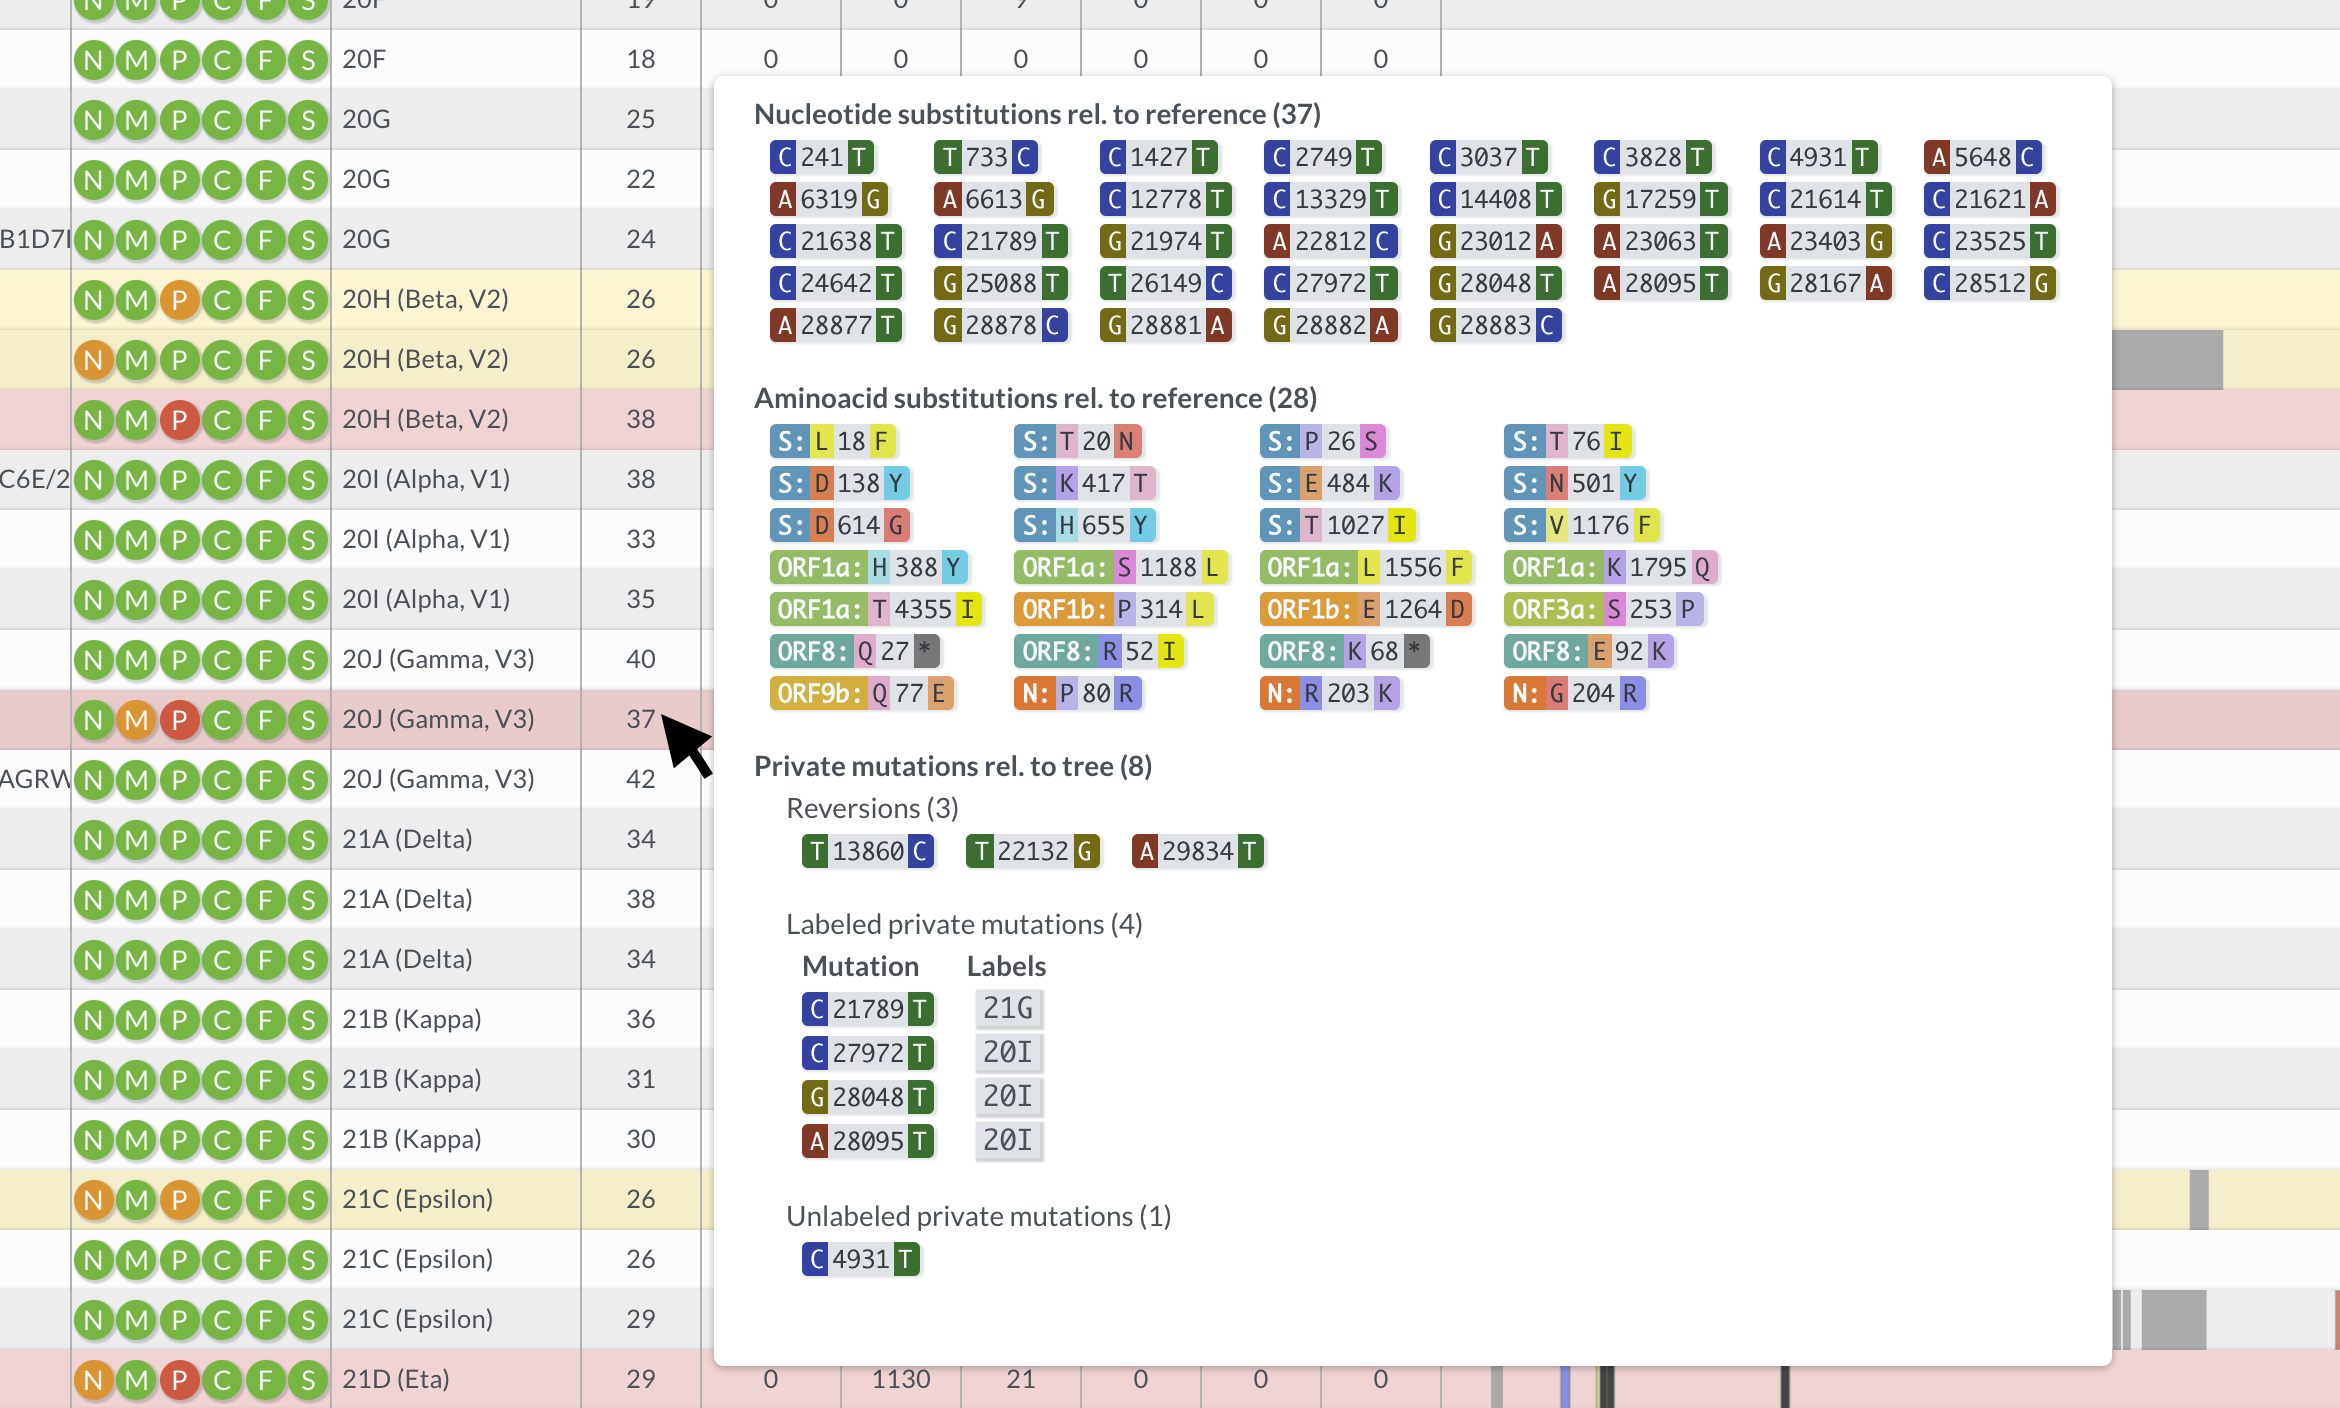
Hovering over table entries reveals more detailed information in tooltips. For example, hovering over the number of mutations reveals which nucleotides and amino acids have changed with respect to the reference, as well as so-called private mutations (mutations that differentiate the query sequence from the nearest neighbor on the reference tree), which are are split into:
Reversions: mutations back to reference, often a sign of sequencing pipeline problems (e.g. faulty primer trimming or reference bias).
Labeled: Mutations that are known, for example because they characteristically occur in a clade. If multiple labeled mutations from the same clade appear, it is often a sign of contamination, co-infection or recombination.
Unlabeled: Mutations that are neither reversions nor labeled.
In the screenshot below, the mouse hovers over a 20J (Gamma) sequence. The tooltip shows there are 3 reversion and 4 labeled mutations, indicative of sequence quality problems, potentially a contamination with 20I (Alpha).
Some datasets, like SARS-CoV-2 and influenza have extra columns with additional information, e.g. gain/loss of glycosylation sites or immune escape score. For details, hover over the column header or consult the datasets’ summary page (README).
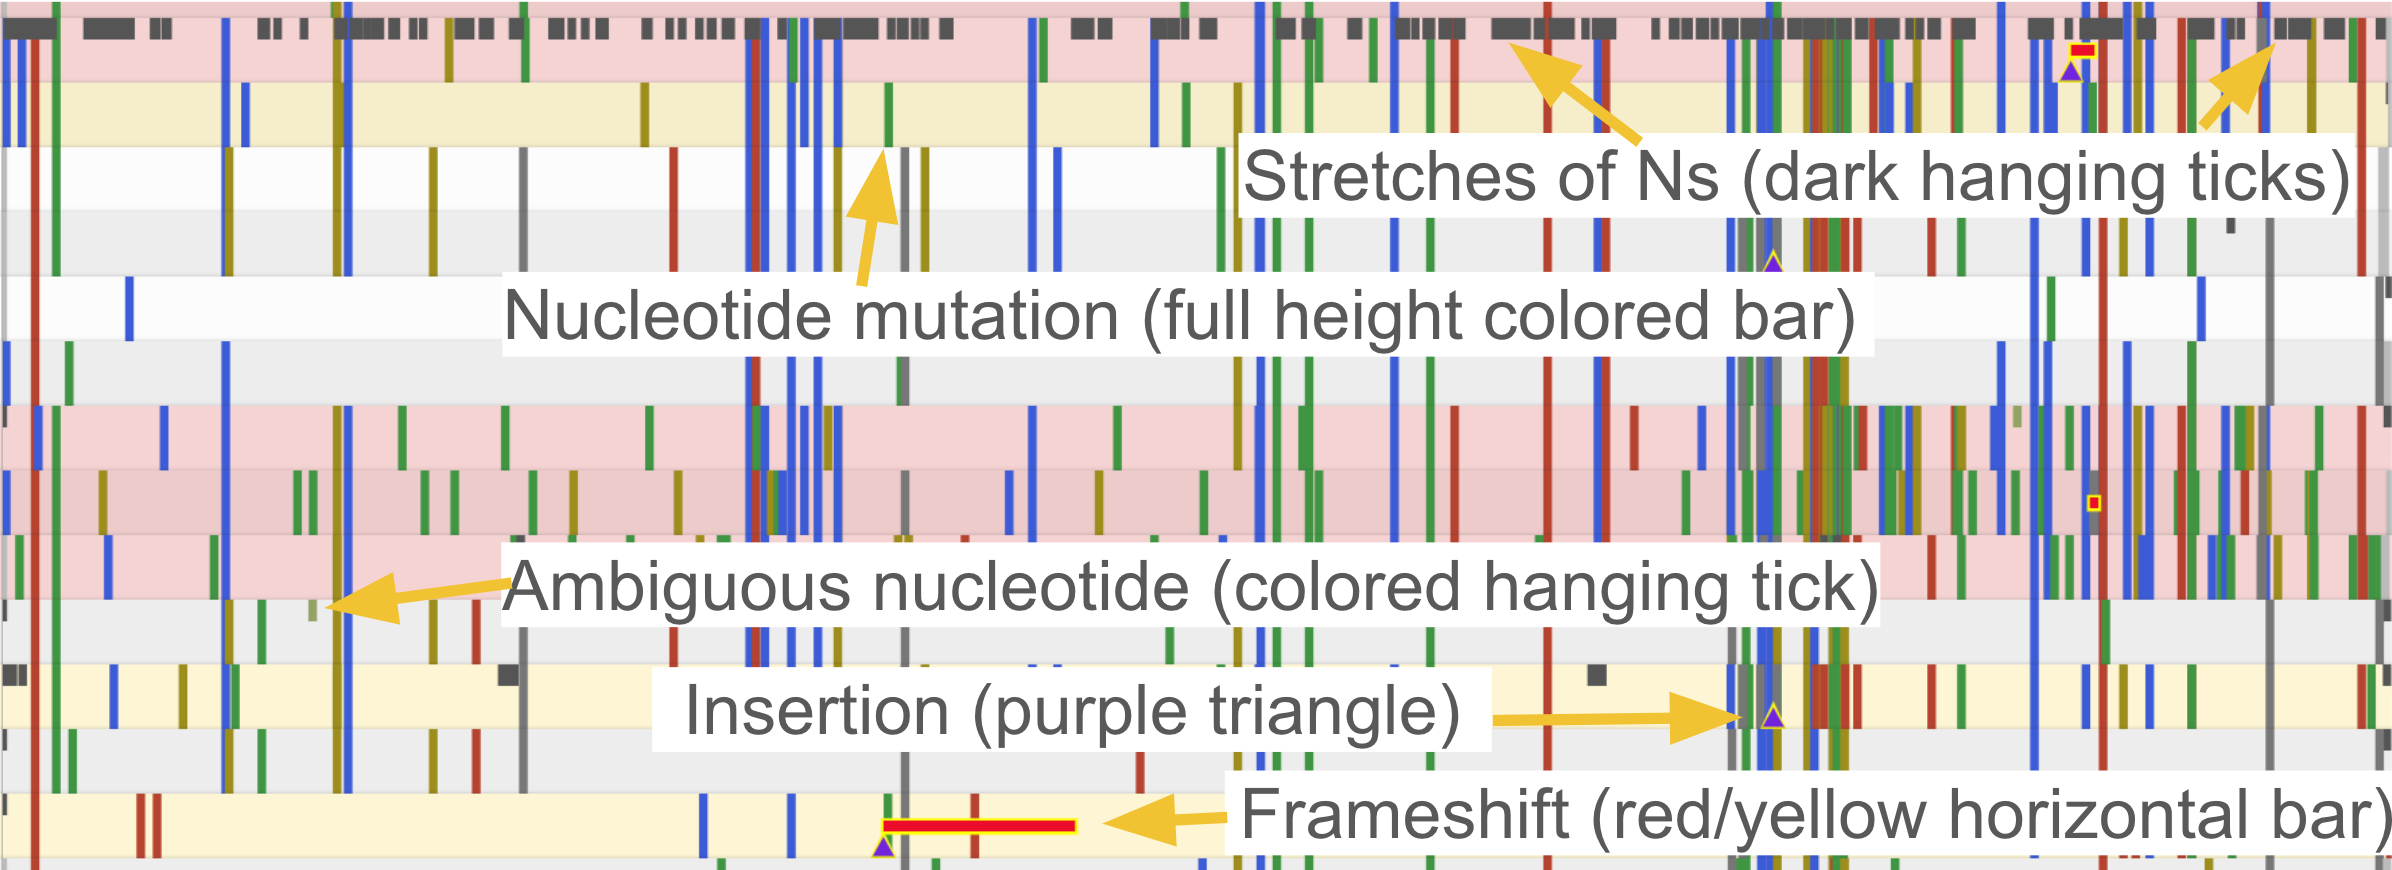
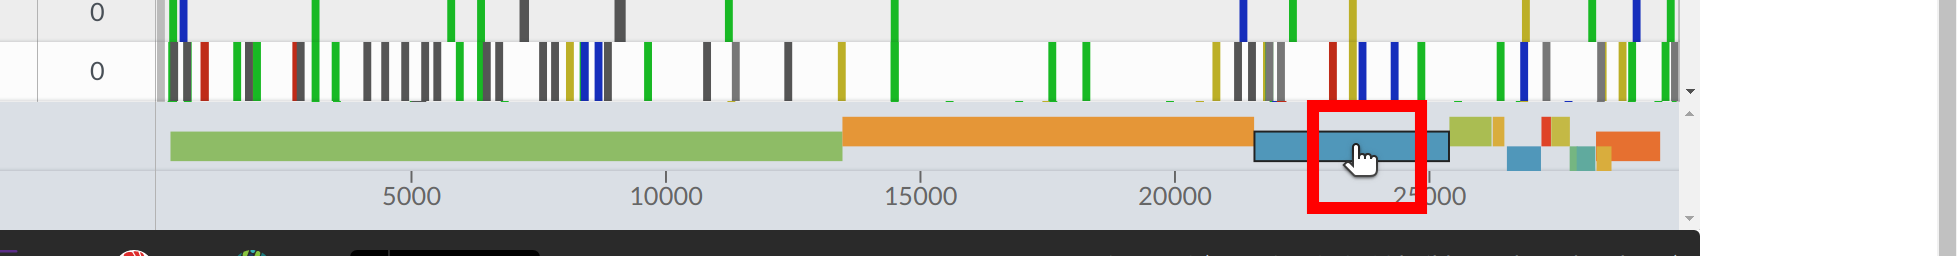
Alignment viewer
To the right of the table you can see the alignment with mutations and regions with missing data highlighted in grey. You can quickly check how segments of missing data are distributed on the genome - whether it’s a few big chunks clustering in one area or many small missing segments.
If you hover over a feature, you can see its name and coordinates.
You can zoom into a CDS/gene by clicking on the respective CDS/gene at the bottom, or selecting the CDS/gene of interest from the dropdown at the top.
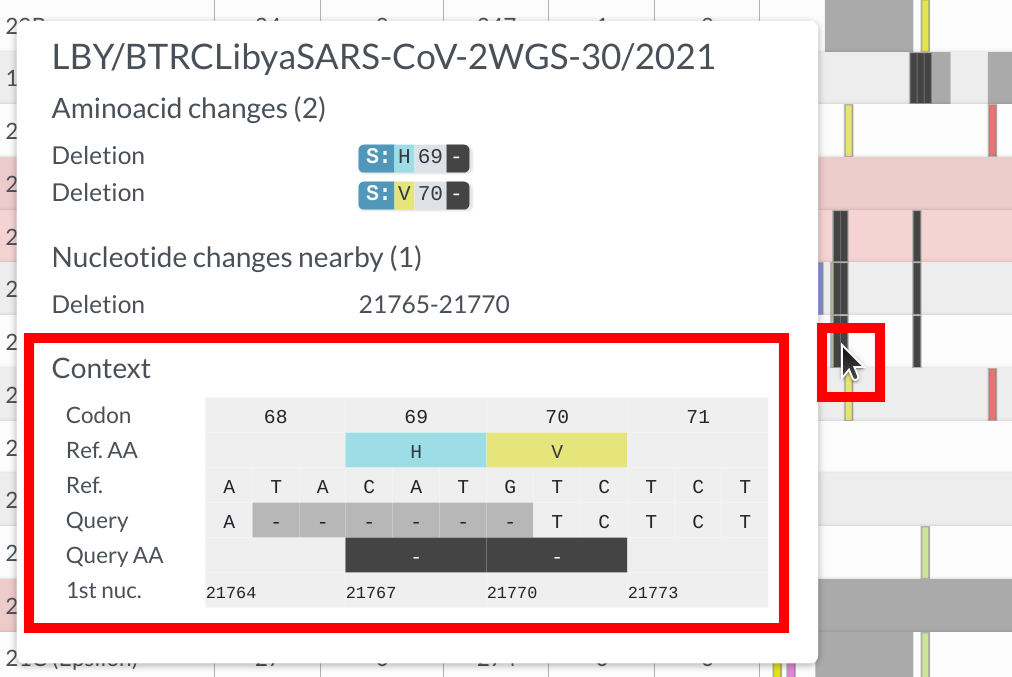
In sequence view, one can observe mutations in a particular gene. One of Nextclade’s strengths is that nucleotide and amino acid changes are visualized in the tooltip in a codon-aware way, as you can see in the example below
Multi-dataset mode
In multi-dataset mode, you can switch between datasets through the dataset selector on the top left. For each selected dataset, you will see only the sequences that were analyzed with that dataset.

Next steps
After the analysis is complete, you can view the phylogenetic tree with your sequences placed on it: See Phylogenetic tree view for details.
You can also download the analysis results in a variety of formats: See Export for details.