How data is exported by Augur for visualisation in Auspice
This page is intended to describe which data underpins the different parts of an Auspice visualisation, and how this data can be produced and exported via Augur. It is not a comprehensive guide for how to generate the data in the first place, nor how to interpret them in Auspice, but it should help understand how to export your data and how to customize the visualization.
This guide is based on Auspice version 2.39 and Augur version 18.0.0. We will endeavour to keep this up-to-date however if you are using newer versions it may pay to check the Auspice changelog or the Augur changelog for any salient changes.
Auspice (visualization) components
It’s helpful to start in Auspice and then work backwards to Augur. In this section, we will walk through various components of Auspice and how they relate to the dataset JSON (sometimes called an Auspice JSON).
Phylogeny Tree Panel and Core Controls
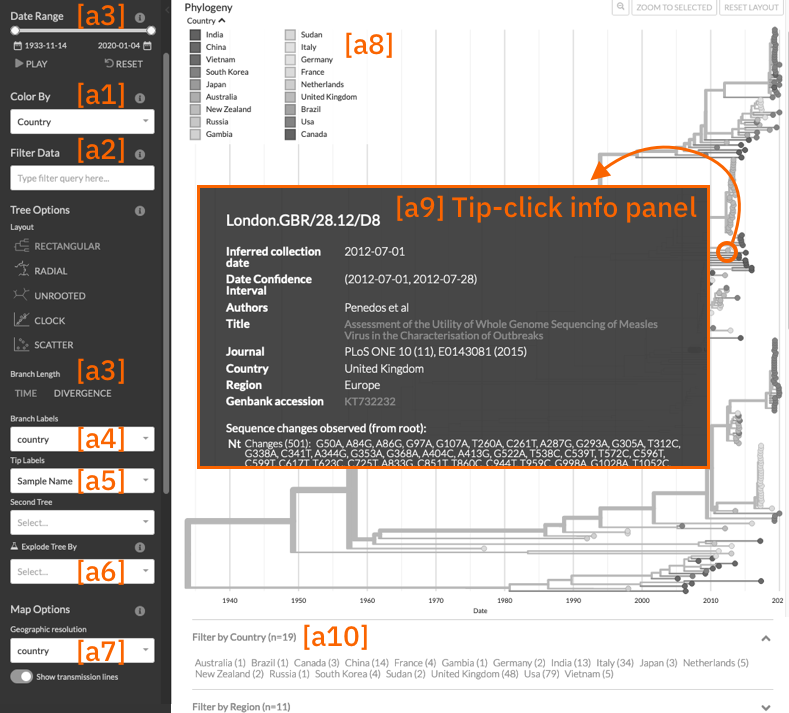
We’ll use the following annotated screenshot of the measles virus tree (built using this Augur pipeline) to introduce the various components of the phylogeny tree panel and the core controls:
Generally, data is defined on individual tree nodes in this dataset JSON
via node.node_attrs (dictionary) or node.branch_attrs (dictionary).
Dataset-wide metadata such as color scales are typically defined within the
top-level meta (dictionary). The best place to really understand the data
structures is the JSON schema
however as an illustrative example we can look at the data structure behind the tip
highlighted in the screenshot above:
{
  "name": "London.GBR/28.12/D8",
  "node_attrs": {
    "accession": "KT732232",
    "url": "https://www.ncbi.nlm.nih.gov/nuccore/KT732232",
    "author": {
      "author": "Penedos et al",
      "journal": "PLoS ONE 10 (11), E0143081 (2015)",
      "paper_url": "https://www.ncbi.nlm.nih.gov/pubmed/26569100",
      "title": "Assessment of the Utility of Whole Genome Sequencing of Measles Virus in the Characterisation of Outbreaks",
      "value": "Penedos et al"
    },
    "div": 0.03952195183861181,
    "num_date": {
      "value": 2012.4986338797814,
      "confidence": [2012.4986338797814, 2012.5721716251735]
    },
    "country": {
      "value": "United Kingdom"
    },
    "region": {
      "value": "Europe"
    },
  },
  "branch_attrs": {
    "labels": {
      "aa": "P: S103P; V: S103P"
    },
    "mutations": {
      "P": ["S103P"],
      "V": ["S103P"],
      "nuc": ["A1184G", "T2113C", "G9914A", "C11201T", "A11522C", "C11843T", "A13151T"]
    }
  }
}
[a1] Colorings
The available colorings are defined by meta.colorings (array of dictionaries),
where each coloring specifies a key which accesses the relevant data in the
node_attrs. As well as a key, a title can be specified (which is what the user will see),
as well as information about the scale used.
The Genotype coloring is a special case that requires the mutations
to be provided via branch_attrs.mutations. [1] For Auspice to color the
tree even when mutations are not present, the root-sequence sidecar file
must be provided.
[a3] Temporal display of the tree
If num_date is set on all nodes (including internal nodes) then the
TIME branch metric and the Date Range selector is available.
Note that to colour the tree by this a corresponding entry in the colorings is required.
Conversely, for DIVERGENCE then div (cumulative) must be set on all nodes in the tree.
[a4] Branch Labels
Any keys pair defined in node.branch_attr.labels (dictionary of strings)
anywhere in the tree will be available in the branch labels dropdown.
[a5] Tip labels
This uses the same data as colorings, as well as node.name (“Sample
name”, which is the default labelling).
Note that genotypes (key: “gt”) can’t be used as tip labels (future improvement).
[a6] Explode tree choices (experimental)
Generally, exploding a tree requires an attribute that is both discrete and defined across the entire tree. As this feature is still experimental, we currently use the defined colorings (see [a2], above) excluding any which use a continuous scale and excluding genotypes. Use this feature with caution — you are responsible for choosing sensible attributes on which to explode the tree!
[a7] Geographic resolutions
These are defined via metadata.geo_resolutions (array of dictionaries) in
the same format as colorings, and thus an optional “title” may be specified.
The key should correspond to both node_attrs (on some or all nodes).
Each of the values in the tree (associated with this key) should have a
corresponding latitude and longitude defined under demes in this dict.
The “Show transmission lines” toggle will only appear if the attribute is defined on internal nodes (as well as terminal nodes).
Note
This has no effect on the tree, unlike all other blocks described here.
[a8] Legend Swatches
For a given coloring (see [a1], above) the set of values observed for this coloring across the tree is displayed as a swatch. This is responsive — only the currently in view part of the tree is considered, so as you filter the data and zoom the tree the swatches will update. For continuous and temporal scales, the values are grouped into bins automatically (unless specified in the scale).
[a9] What’s shown when clicking on a node?
For the selected node Auspice displays the following information, as applicable:
Strain name, as defined by
node.name.Vaccine information (
node.node_attrs.vaccine), if applicable.Sample date (
node.node_attrs.num_date) as well as any associated confidence values. For internal nodes this is always labelled as “Inferred date”; terminal nodes are labelled as “Inferred collection date” if a non-zero uncertainty range is provided, otherwise “Collection date”.Publication info, if provided. This considers
node_attrs.author(dictionary) and its associated keysvalue,title,paper_url,journal(onlyvalueis required).Strain information. This considers
node_attrs.gisaid_epi_isl,node_attrs.genbank_accession,node_attrs.accessionandnode_attrs.url. [2]Any other
node_attrsprovided are displayed. If the attribute is also a colouring then the colouring title will be used. Note that associated confidence values are not displayed.branch_attrs.mutationsare displayed.For terminal nodes, we traverse the tree to display the total mutations between the root node and this tip. This allows us to categorise mutations as “Changes” or “Reversions to root”. Note that (e.g.) a series of mutations such as “A -> T -> C” at position 100 will be shown as “A100C”.
For internal nodes we show the mutations ascribed to the branch but categorise them as “Unique”, “Homoplasies” and “Reversions to root”. Note that the first two categories are mutually exclusive however a mutation may appear again in the “Reversions to root” category, as applicable.
Diversity (Entropy) Panel
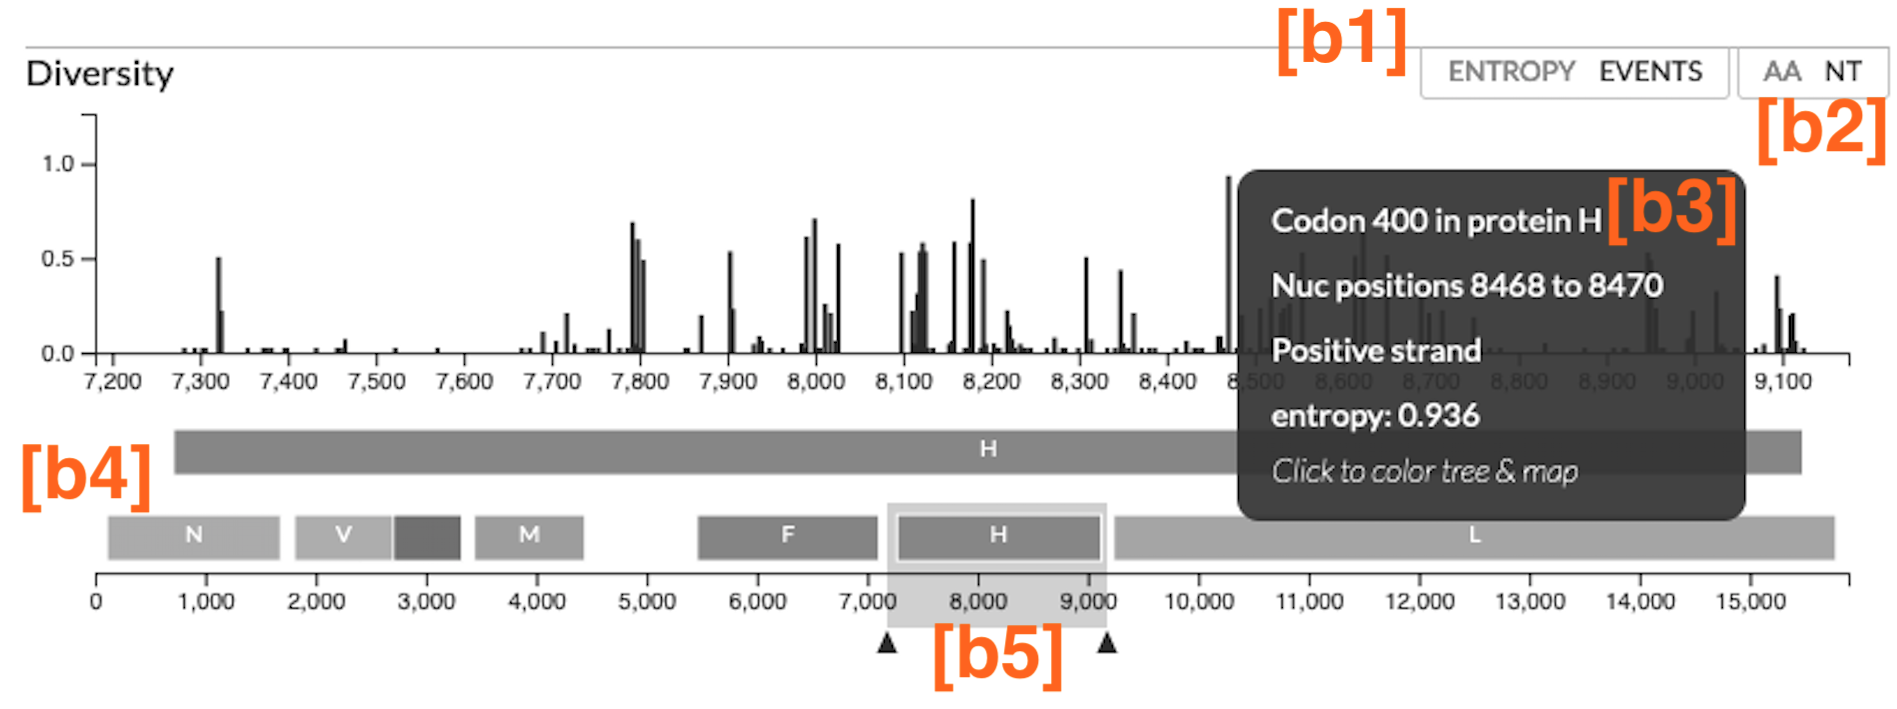
We’ll use the following annotated screenshot of the diversity (entropy) panel of the measles virus tree (built using this Augur pipeline) to introduce the various components:
The diversity panel is enabled by data in the dataset JSON.
The top-level meta.genome_annotations provides the genome annotations
displayed and the individual tree nodes provide the mutations
via node.branch_attrs.mutations, which are used to calculate the entropy
and to count the mutation events.
Gaps in nucleotides (-), masked nucleotides (N), and unknown amino acids (X) are
excluded from the calculations and counts. Only mutations from visible tree
nodes are included in the calculations for the diversity panel, so the entropy values
and event counts will change when you turn on a filter or zoom into a subtree.
[b1] Toggle between Entropy and Events
ENTROPY represents normalized Shannon entropy, measuring the “uncertainty” inherent in the possible nucleotides or codons at a given position.
EVENTS represent a count of changes in the nucleotide or codon at that
position across the visible tree. Changes to and from the excluded characters
(- and N for nucleotides; X for amino acids) are ignored in the counts.
Mutations are counted by traversing the entire visible tree and adding the
changes provided via node.branch_attrs.mutations. The entropy calculation
is performed within Auspice using these observed mutations and the number of
visible tips with each mutation.
Suppose the tree has the following codons at a single position:
codons |
tips |
|---|---|
H |
1378 |
L |
1 |
P |
643 |
R |
1177 |
Total |
3199 |
The entropy calculation for the position would be:
[b2] Toggle between Amino Acids (AA) and Nucleotides (NT)
Both the entropy and events plots can be toggled between the amino acids (AA)
and nucleotides (NT) views. When set to AA, entropy and events are
calculated per gene provided via meta.genome_annotations.<gene_name>.
The mutations for the matching <gene_name> provided via node.branch_attrs.mutations.<gene_name>
are included in the calculations. When set to NT, entropy and events
use the nucleotide mutations provided via node.branch_attrs.mutations.nuc.
[b3] What happens when you interact with the bars on the plot?
Hovering over a vertical bar will bring up an information panel that displays:
Codon position within the gene and nucleotide position within the sequence.
In the AA view, the codon position is based on the mutation position provided in
node.branch_attrs.mutations.<gene_name>. The nucleotide positions are calculated using the codon position, themeta.genome_annotations.<gene_name>.startvalue, and themeta.genome_annotations.<gene_name>.endvalue.In the NT view, the nucleotide position is based on the mutation position provided in
node.branch_attrs.mutations.nuc. If the nucleotide position is within a gene in themeta.genome_annotations, then the codon position is calculated using the nucleotide position, themeta.genome_annotations.<gene_name>.startvalue, and themeta.genome_annotations.<gene_name>.endvalue.
If the bar is within a gene, the information panel will include whether it’s positive or negative strand from the description provided in
meta.genome_annotations.<gene_name>.strand.Entropy or events value calculated for in view tree nodes as described above.
Clicking on a vertical bar will change the coloring to color by Genotype. In the AA view, colors will be set to genotype at the codon site of the gene. In the NT view, colors will be set to genotype at the nucleotide position.
[b4] Genome Annotations
The x-axis shows the nucleotide positions and the genome annotations with one-based
starting positions. The lower x-axis shows the entire genome with all provided
genome annotations from the top-level meta.genome_annotations. The upper
x-axis shows a view of the currently zoomed in section of the genome.
[b5] Zoom in the plot
By default, the diversity panel shows the entire genome. Users can drag either
side of the grey box to zoom into specific sections of the genome.
For example, the annotated image shows a zoomed in view of the hemagglutinin (H) gene.
The grey box can also be dragged across the x-axis to zoom into a different
section of genome while preserving the zoomed length. This zoomed view
cannot be set within the dataset JSON, but it can be set with the
URL parameters
gmin and gmax.
Exporting data via Augur
We now consider how information flows through Augur, specifically
augur export v2 which produces the dataset (Auspice) JSON
described above. This process combines data inputs with parameters configuring
aspects of the visualisation and produces dataset files for
Auspice to visualise.
This guide will explain the functionality using an Auspice config
JSON, usually named auspice_config.json, to control which data is exported and how it is presented in Auspice,
however it is possible to use command-line arguments to specify
a subset of this configuration instead; please run augur export v2 --help
to see the available options here.
The most comprehensive description of this file is via
its schema, however to
introduce this file here’s a snippet of the Auspice config JSON for the
measles dataset presented above:
{
  "title": "Real-time tracking of measles virus evolution",
  "colorings": [
    {"key": "num_date", "title": "Date", "type": "continuous"},
    {"key": "country", "title": "Country", "type": "categorical"}
  ],
  "geo_resolutions": ["country", "region"],
  "display_defaults": {
    "map_triplicate": true
  },
  "filters": ["country", "region"]
}
What metadata is exported
Augur has two main types of “metadata” which we’ll refer to as
“TSV-data” (provided with the --metadata argument) and “node-data”
which are JSONs provided via --node-data (see data formats for more).
Typically, node-data information is automatically exported as a coloring whereas
TSV-data must be explicitly exported by requesting it as a coloring in the
auspice-config JSON. [3] Metadata is exported as a coloring if via the
following process:
All key-value pairs specified in node-data JSONs, unless they match a hardcoded-list of exclusions and special-cases (next section). This has the effect that data provided in node-data JSONs will form a coloring and thus be exported in the dataset JSON.
Command-line provided colorings (not covered in this guide)
Colorings specified in the
auspice_config.json(see below)
Metadata keys <X>_entropy (numeric) or <X>_confidence (dictionary),
assuming key <X> exists, will be combined into the same node.node_attrs.X data structure.
Auspice uses the entropy value to influence the saturation of the color and
the confidence data is shown when hovering / clicking on the branch/node.
Special cases (keys which are excluded or behave differently)
To maintain backwards compatibility a number of keys are excluded or special-cased here and should be treated with caution. If you need to check a particular key you can search for it in the code, but currently these keys include:
any key which ends with
_confidenceor_entropy(see previous section)annotations,aa_mutsandmuts(see How branch mutations are exported, below)mutation_lengthandbranch_lengthare converted to the tree’s divergence values [4] and exported asnode.div(float); with the first matching key being used. This is optional — time only trees are just fine.key
hiddenis only exported if its value is one of “always”, “divtree”, “timetree”. We don’t cover this behavior here, and it is somewhat experimental, so try it out first!key
clade_membershipgets the titleClade(unless you provide one)key
num_date(numerical date) gets the titleSampling Date(unless you provide one) and typecontinuouskey
authorgets the titleAuthors(unless you provide one) and the exported data structure will incorporate any of the following metadata keys:journal,authors,titleandpaper_url. [5] In effect, this means that none of these keys are available to be a coloring themselves (apart fromauthor).Some keys are deprecated & changed on-the-fly:
author→authorsandnumdate→num_datekey
gtgets the titleGenotype; this is automatically created if annotations are defined (see How branch mutations are exported section below) but you can supply your own title if you like. Note that metadata provided under the keygtmay be exported, but it won’t actually be used by Auspice!clade_membershipis converted to a branch label, see Branch Labels section below.vaccinemust be a dictionary with special keys (via a node-data JSON); see the the dataset schema for full details. Auspice uses this to render crosses over certain tips in the tree. This means thatvaccinecannot be a coloring itself.The following keys are typically ignored:
date,raw_date,clock_length,sequence,aa_sequences,dTiter,dTiterSub. If you wish to export them then you must specify them in your auspice config.
How conflicting metadata is resolved
Node-data JSONs are combined using a deep-merge approach, where we recurse into dictionaries. For non-dictionary values we will overwrite previously seen values, so the order of JSONs provided matters! The information for each node is then added to the per-node (per-strain) TSV-data, with the node-data being used in the case of duplicate keys. As a contrived example:
// node-data file 1
nodes: {NODE_NAME: {country: "USA", region: "North America"}}
// node-data file 2
nodes: {NODE_NAME: {country: "Canada"}}
// metadata TSV
{NODE_NAME: {country: "Mexico", serotype: "ABC"}}
// resulting merged metadata
nodes: {NODE_NAME: {country: "Canada", region: "North America", serotype: "ABC"}}
Configuring coloring names and types
The colorings in the auspice-config JSON typically link the key (where the metadata is to be found) to a title (how the key is to be presented in Auspice) and a type (how should the color scale be constructed). Setting the type to one of “continuous”, “temporal”, “ordinal”, “categorical” or “boolean” lets Auspice use the appropriate color scale.
To use these categories the data should be in the format:
“boolean” - values should all be within
["false", "true", "1.0", "0.0", "1", "0", "yes", "no"]; coloring will be binary“continuous” - values should be numeric; coloring will be a range between the minimum & maximum values
“temporal” - values should be dates in decimal date format (
2022.365); coloring will be a range, and the legend will display human-readable dates“ordinal” - values should be integers; coloring will be a range but all displayed values will be integers
“categorical” - each unique value will receive a different color, the color wheel will be repeated if necessary
If the type is not provided, it will be inferred in this order:
“boolean” if all values are within boolean values defined above.
“continuous” if all values are numeric.
“categorical” if none of the above are satisfied.
The provided colorings in the auspice-config JSON will result in corresponding metadata being exported. As mentioned above, for node-data provided metadata this is not necessary, but if in doubt it’s safest to provide this information in the auspice-config JSON.
Configuring color scales and legends
A colors TSV file may be provided to augur export v2 which is the
most common way to associate (discrete) values with actual colors. Such
a file has 3 tab-separated columns: the coloring key, the metadata
value, and the color hex; no headers are necessary. As an example, here
are (some of) the colors TSV
used in the measles build:
region  oceania #88BB6C
region  west asia   #ADBD51
region  africa  #CEB541
region  europe  #E39B39
See the guide on custom trait colors for more details on how to use the colors TSV.
Augur itself provides a default set of colors, currently only for “region”. This means that if you don’t specify any colors for region then we’ll use the defaults, however if you specify any colors for “region” in the TSV then the defaults won’t be used (i.e. there is no merging).
This is all optional - if you don’t provide colors then Auspice will use the provided scale type and create a suitable scale for you. Remember that if you define any colors, then you should define them all (for that coloring) - any metadata values you don’t provide colors for will be shown in greyscale!
You can instead define which colors are used in the auspice-config JSON; this is a bit more involved but provides greater flexibility. For discrete scales, you can link individual values to color hex codes (similarly to the colors TSV approach, values not listed here will use a greyscale in Auspice) or for continuous scales by linking pivot points to colours which Auspice will interpolate between to create the final scale. Separate to the color definitions you can limit what values are present in the legend and how they are displayed. For full details please see the schema but the following example may illustrate what’s possible:
"colorings": [
  {
    "key": "num_date",
    "title": "Date (custom colors)",
    "type": "continuous",
    "scale": [
      [2000, "#edf8b1"], [2020, "#7fcdbb"], [2022, "#2c7fb8"]
    ],
    "legend": [
      {"value": 2010, "display": "<2020", "bounds": [2000, 2020]},
      {"value": 2020.5, "display": "2020", "bounds": [2020, 2021]},
      {"value": 2021.5, "display": "2021", "bounds": [2021, 2022]},
      {"value": 2022.5, "display": "2022", "bounds": [2022, 2023]}
    ]
  },
  {
    "key": "serotype",
    "title": "Serotype",
    "type": "categorical",
    "scale": [
      ["DENV-1", "#781C86"], ["DENV-2", "#83BA70"], ["DENV-3", "#547BD3"], ["DENV-4", "#DF4327"]
    ]
  }
],
Finally, nodes with missing or unknown data [6] are automatically set to gray in the tree and the “unknown” values will not be present in the color legend.
Branch Mutations and Diversity (Entropy) Panel
The branch mutations and the diversity (entropy) panel are enabled by the same nucleotide mutations, amino acid mutations, and genome annotations provided via the dataset JSON. The genome annotations are required for the diversity panel in Auspice.
If these metadata are available, then a special coloring is created in
the exported dataset JSON: {"key": "gt", "title": "Genotype", "type": "categorical"}
which is used by Auspice to allow coloring by genotype.
You can also define this in the auspice-config JSON if you wish to use a
different title.
Nucleotide Mutations
The nucleotide mutations are assigned to internal nodes via augur ancestral.
The mutations are output to a node-data JSON as nodes.<node_name>.muts.
The node-data JSON is passed to augur export v2 via the --node-data option
and the nucleotide mutations are exported as node.branch_attrs.mutations.nuc.
See augur ancestral for more details on how the nucleotide mutations are assigned.
Amino Acid Mutations
The node-data JSON output from augur ancestral includes the nucleotide sequences
for internal nodes as nodes.<node_name>.sequence, which are passed to augur translate
to translate and generate the amino acid mutations. The mutations are output to
a node-data JSON as nodes.<node_name>.aa_muts.<gene_name>.
The node-data JSON is passed to augur export v2 via the --node-data option
and the amino acid mutations are exported as node.branch_attrs.mutations.<gene_name>.
See augur translate for more details on how the amino acid mutations are generated.
Genome Annotations
The genome annotations are also generated by augur translate.
The features of the reference sequence, provided via --reference-sequence,
are formatted according to the annotations schema
and output to the node-data JSON as annotations. augur export v2 directly exports
these annotations as meta.genome_annotations.
Branch Labels
Currently branch labels are unable to be specified beyond two special cases, and there is no way to customize their appearance via the auspice-config JSON. We are in the process of improving this.
If the key
clade_annotationis present, these are converted to the “Clade” branch label (node.branch_attrs.labels.clade).If amino acid mutations are defined, then the
aabranch label is automatically created.
Geographic resolutions and lat-longs
The map (geographic) panel in Auspice works by associating certain metadata with lat-long values. The metadata keys used for this are called “geographic resolutions”, and are exported if the certain criteria are met.
The auspice-config JSON should define the geo_resolutions as a list
of either dictionaries or strings; the former allows more customization
but the latter is much simpler.
Example auspice-config JSON using strings:
"geo_resolutions": [
  "country",
  "region"
]
Example auspice-config JSON using dictionaries:
"geo_resolutions": [
  {"key": "country", "title": "Custom Country Title"},
  {"key": "region", "title": "Custom Region Title"}
]
The specified keys will be exported from the metadata inputs (“country” and “region”, in the above examples). Finally we need a mapping of the metadata values, called “demes” (e.g. the individual countries or regions) to their lat-long values. This is typically provided via a lat-longs TSV input file, such as:
region  africa  4.070194    21.824559
region  china   35.000074   104.999927
region  europe  49.646237   10.799454
Augur has some defaults configured for “region”, “country” and “division” which are merged in with any user-provided data (the latter takes precedence). We also maintain a very large set of these for our ncov build which may be a helpful reference.
If a deme is defined on the tree but no lat-long value is provided then
it will not be shown in Auspice. In these cases augur export v2 will
print a warning.
Specifying which colorings are available as filters
Select (discrete) colorings are available for filtering in Auspice (both via the sidebar UI and listed in the footer) if they are defined in the auspice-config JSONs filters list:
"filters": ["country", "region", "..."]
Additionally, each mutation and strain name will be automatically available in Auspice’s sidebar UI for filtering.
Note
This behavior may change in the future; ideally all exported metadata should be searchable via Auspice’s sidebar filtering UI.
Customizing the Auspice defaults and available panels
There are a number of other sections of the auspice-config JSON which can configure how Auspice presents the exported data.
The panels (array, with entries of “tree”, “map”, “frequencies”, “entropy”, “measurements”) restricts which panels are available to be rendered in Auspice. By default all panels the dataset supports are available.
The display_defaults (dictionary) configures the defaults for many of Auspice’s UI settings, such as which coloring to use. Please see the Auspice documentation for a list of these.
The data_provenance (list of dictionaries) defines the source of the
data. This is exported as meta.data_provenance and is rendered by
Auspice at the top of the page.
The build_url (string) specifies URL with instructions to reproduce the build, which is typically a GitHub repo URL. This is used by Auspice in the page header.
The maintainers (array of dictionaries) is used in the Auspice header to identify who created or maintains the dataset.
As an example, here’s how the measles auspice-config uses these keys and you can see here how Auspice renders these:
"title": "Tutorial Nextstrain build for Zika virus",
"maintainers": [
  {"name": "Trevor Bedford", "url": "http://bedford.io/team/trevor-bedford/"}
],
"build_url": "https://github.com/nextstrain/zika-tutorial",
"panels": [ "tree", "map", "entropy" ],
"display_defaults": {
  "map_triplicate": true
}
Footnotes