Writing a narrative
The following will walk you through writing a Nextstrain narrative. We’ll look at a basic 3-slide narrative to explore the functionality of narratives. The aim is for you to feel comfortable with the technical aspects of creating and troubleshooting narratives.
For an introduction to the concept of Narratives, please see Communicating Results Using Narratives or take a look at this example narrative, Twenty years of West Nile virus.
This tutorial will rely on the new Narratives Debugger which allows you to drag & drop the Markdown files introduced here and instantly see a summary of the narrative.
Note
This guide uses the narratives debugger on nextstrain.org; while you can also use this by running Auspice on your computer there are some differences - see below for more details.
Prerequisites
To follow this tutorial, you will need:
A (basic) understanding of writing Markdown (here is good introduction).
Familiarity with the general concept of Nextstrain Narratives (see Communicating Results Using Narratives to get started).
Ability to edit a Markdown file on your computer (in any text editor).
The Narratives Debugger open in an internet browser.
The basics of how a narrative works
The content of a narrative is all within a single Markdown file, and this file contains Nextstrain dataset URLs from which the interactive visualisations are sourced. We’ll introduce the basic functionality via an example Markdown file below, which describes three slides:
The title slide (the section surrounded by
---lines)A slide showing the latest available monkeypox phylogeny
A slide looking back at the rise and fall of Influenza clades over the past 12 years
---
title: Introduction to narratives
authors: Nextstrain
authorLinks: "https://nextstrain.org"
date: "2022-11-01"
dataset: "https://nextstrain.org/monkeypox/hmpxv1?d=map&p=full&c=region"
abstract: "
3-slide narrative to introduce how to write narratives.
This narrative is intended to be used as part out the
[Writing a Narrative](https://docs.nextstrain.org/en/latest/tutorials/narratives-how-to-write.html)
tutorial.

This opening slide is looking at monkeypox genomes focusing
on the current outbreak. This view into the data is taken from
the associated URL: https://nextstrain.org/monkeypox/hmpxv1?d=map&p=full&c=region
"
---

# [Monkeypox](https://nextstrain.org/monkeypox/hmpxv1?d=tree&p=full&c=region)

We've now changed the view from the map to the phylogenetic tree.
This was achieved by changing the dataset URL to indicate that
the display panel should change from the map to the tree.

```
Title slide: monkeypox/hmpxv1?d=map
This slide:  monkeypox/hmpxv1?d=tree
                                ^^^^
```

In practice, you don't need to remember the URL syntax, rather
you can manipulate the visualization (on nextstrain.org) and then
simply copy & paste the URL once you are happy with the current
view into the data.


P.S. The B.1 clade is the main outbreak clade & we can see a distinct
comb-like appearance, with limited clustering of samples.
This structure is typical of new, fast-spreading outbreaks.
The tree is colored by region & we can see that the outbreak clade
is dominated by samples from Europe and the Americas, whereas the
basal (older) cases were typically from Africa.


# [The rise and fall of Influenza clades](https://nextstrain.org/flu/seasonal/h3n2/ha/12y?d=tree,frequencies&p=full)

We switch now to a completely different viral phylogeny - that of
Influenza H3N2 over 12 years. This switch was made by defining a
different dataset in the URL associated with this slide
(https://nextstrain.org/flu/seasonal/h3n2/ha/12y?d=tree,frequencies&p=full).
It is this URL which specifies that we should view both the tree & the
frequencies panel 👉

P.S. This phylogenetic structure is very different, more latter-like than
comb like, a phenomena which is linked to antigenic evolution
([Bedford, Rambaut & Pascual, 2012](https://bmcbiol.biomedcentral.com/articles/10.1186/1741-7007-10-38)).
You can see a copy of this Markdown file on GitHub, and you can see the resulting narrative displayed in Nextstrain at nextstrain.org/narratives/how-to-write/basics.
This tutorial will make use of our narratives debugger, which is available at nextstrain.org/edit/narratives. To introduce this functionality,
Copy/download the above Markdown to a file on your computer. The filename must end with
.md.Drag the Markdown file onto the Narrative Debugger page. You should see something like the top half of this figure:
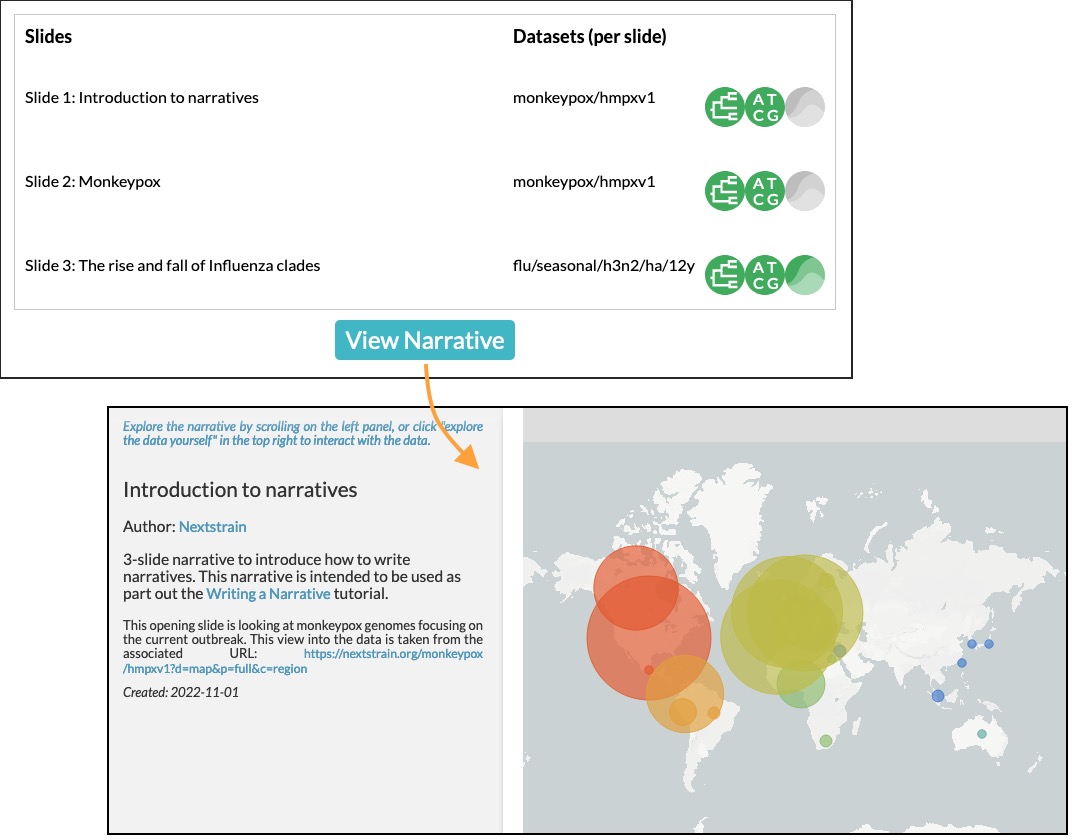
You can see the titles of the three slides and their associated datasets. Hover over one to see the full appearance of the slide.
To the right of each title is the associate phylogenetic dataset and a series of icons representing the main + sidecar JSONs associated with the dataset. The icons represent whether the dataset exists on nextstrain.org – in this case, they are all green (success) or grey (not attempted).
When writing a narrative, it’s easy to make syntax errors that result in invalid datasets. To observe this, try changing a dataset URL in the Markdown file and dragging the file back onto the debugger.
Clicking on the title of a slide will jump into the narrative at that slide, or you can click the View Narrative button to start from the beginning.
Note
The narrative file you drag onto the debugger remains within your browser and is not sent to the Nextstrain server. The datasets it specifies must be accessible through nextstrain.org and are fetched (downloaded) when you are testing a narrative; these can include private Nextstrain Groups assuming you are logged into nextstrain.org & can access those private datasets.
A typical writing process
Hopefully the above section gives you enough to get started writing your own narratives. There are more technical details to follow, but if you want to get started we encourage trying it out! There are plenty of ways to approach the task, but we find the following workflow tends to work well:
In the future, we plan to expand the debugger with editing capability. For now, any changes to the narrative must be made in the Markdown file itself. When you are happy with the end result, see below for how to publish it on nextstrain.org.
Understanding the structure of narrative slides
Title slide (frontmatter)
The opening (title) slide is defined in the Markdown file by an opening YAML frontmatter block, which is the part between the two --- lines in the above example.
This defines a number of key-value pairs which we transform into the slide you see, all of which are optional except title and dataset.
The possible content which can be rendered is listed below, in the order they would appear on screen:
The main title is taken from the
titlekey.The authors are then listed; these can be provided via
authorsandauthorLinkswhich should either both be strings or both be arrays of the same length. TheauthorLinksis optional but recommended!Any translators are then listed, encoded in the same format as the authors but using keys
translatorsandtranslatorLinks.The abstract, defined by
abstractis a string which will be rendered as Markdown [1].When the narrative was first created (
date) and when it was most recently updated (updated) is then displayed.Finally, any applicable license is shown, as defined by
licenseandlicenseLink.The
datasetis required and defines the data view in the right hand side of screen (see see below).
Normal slides
The rest of the Markdown file defines one or more slides. Each slide is defined by a level 1 heading which must link to a dataset, followed by a section of Markdown which represents the slide’s content:
# [slide title here](nextstrain.org dataset URL here, including (optional) query params)

Markdown content of the slide
This is the third slide from the example narrative above:
# [The rise and fall of Influenza clades](https://nextstrain.org/flu/seasonal/h3n2/ha/12y?d=tree,frequencies&p=full)

We switch now to a completely different viral phylogeny - that of Influenza H3N2 over 12 years.
The dataset URL is detailed below and defines the view into the data shown to the right of the rendered Markdown content.
Linking the view into the data to the URL
At the heart of narratives is the ability for Nextstrain dataset URLs to encode the view settings (e.g. coloring) via the URL query. You can see this in action by changing the view settings of a dataset on nextstrain.org and observing the URL query changing. The available query parameters are detailed in Auspice’s View Settings docs, however in most cases it’s easier to manipulate the visualisation in-browser and then copy the resulting URL into your narrative.
The slides in the example narrative use the following dataset URLs:
https://nextstrain.org/monkeypox/hmpxv1?d=map&p=full&c=region
https://nextstrain.org/monkeypox/hmpxv1?d=tree&p=full&c=region
https://nextstrain.org/flu/seasonal/h3n2/ha/12y?d=tree,frequencies&p=full
The only difference between 1 & 2 is d=map vs. d=tree. This means that when navigating between these slides in the narrative, we change between the map and tree panels. Slide 3 uses a different dataset with both the tree and frequency panels.
Advanced functionality / FAQ
Main Display Markdown
It’s possible to replace the right-hand side view into the data with a full page Markdown rendering, which is useful for adding a large image in a narrative etc. This is done via a specific code fence within the Markdown content of a slide:
# [slide title](dataset URL)

Slide content rendered in the left-hand sidebar (as normal)

```auspiceMainDisplayMarkdown

Markdown content rendered in the right-hand pane of the display, where the dataset would normally be.

_Note that the dataset URL is still required, although unused._

```
Embedding images
Publicly accessible images can be embedded using normal Markdown syntax, for example using this SEM photo of Yersinia Pestis:
### Here's a SEM photo of Y. pestis

If the image is not publicly accessible via a URL, you can also embed it in the Markdown file itself using base64 encoding [2] (see here for a drag-and-drop utility to convert images to base64):

Differences between localhost (Auspice) and nextstrain.org
It’s possible to run a local instance of Auspice (the phylogenetic visualisation app used in nextstrain.org) and view narratives locally, however there are some differences between this and nextstrain.org which are really easy to get tripped up on!
Specifically the hostname is not used – only the pathname is used, and the way the dataset pathname is interpreted is different: Auspice can only access datasets on your computer (in the directory you supply via --datasetDir) whereas nextstrain.org accesses data from a range of places.
The following example of a narrative slide may make this difference clearer:
# [Which dataset is this?](https://nextstrain.org/community/inrb-drc/ebola-nord-kivu)

The dataset displayed here differs if you run it on localhost (auspice)
or through nextstrain.org.

When viewed on nextstrain.org this dataset is sourced from
[this GitHub repository](https://github.com/inrb-drc/ebola-nord-kivu)
as it is using our
[community sharing functionality](https://docs.nextstrain.org/en/latest/guides/share/community-builds.html).

To work when running on auspice locally, we would need to have a dataset
with the following filename: `community_inrb-drc_ebola-nord-kivu.json`.
This complexity encouraged us to build the interactive debugger we have used in this tutorial and we encourage to use that approach rather than developing your narratives using Auspice locally & then trying to share them through nextstrain.org!
Where can I find some example narratives to use as inspiration?
All of the narratives written by the core Nextstrain team are available in this GitHub repo.
Future directions
The app used to test narratives is in its infancy. We hope to incrementally add features such as Markdown editing, changing the dataset view settings, and the ability to publish the narrative to Nextstrain Groups. The eventual aim is to be able to write & publish an entire narrative from within the app, without needing to know any specifics of the Markdown language behind it.
Next steps
Create your own narrative with:
One or more datasets that you wish to visualise. These should be accessible via nextstrain.org. See Share Analyses through Nextstrain for more information.
An idea of what you wish to write for each slide (you can always start with a single slide and add more as you go).
Bugs? Improvements? Suggestions?
The debugger (as of November 2022) is in a beta-release phase. Please get in touch if you have suggestions or find bugs! You can submit an issue on GitHub or make a post on our discussion forum.
Footnotes